With every financial investment comes risk, and risk is almost always linked to the potential return on the investment. This means that investments with a tremendous profit potential also have the most significant chance for loss. Investing in safe assets generally yields low returns. Return improves when the investment term is extended (to about 5-10 years), but risk and volatility reduce as the investment length is prolonged.
What is your risk tolerance?
There are two variables that may be used to determine your level of risk tolerance:
Your investment timeline is the amount of time you have until you require access to the funds you have invested. The more time you have the more risk you can afford to take.
How much risk you are willing to take is known as your "risk appetite." Your risk tolerance is low if you're alarmed if your investments suffered losses. However, if you can handle the market's ups and downs, you may have a higher tolerance for risk.
Fixed Deposit
Banks and non-bank financial companies (NBFCs) provide fixed deposit investment schemes to customers who deposit their funds for a guaranteed return at maturity. Fixed deposits can be an attractive option for risk-averse investors who prefer to have their money virtually completely safe.
Annual returns on fixed-income investments have declined from 9% to about 5% during the previous eight years. What's noteworthy is that since inflation is now hovering around 6%, actual returns could be negative. Inflation tends to offset the accumulation of wealth. As a result, your investments must grow at a pace higher than the rate of inflation. When you get returns after maturity, they are subject to taxation, which impacts your real rate of return.
As a result, it is always a good idea to take a calculated risk and invest in stocks or equity-related index funds with a long-term perspective.
NIFTY
The NIFTY 50 index comprises the top 50 large-cap businesses in India that are market leaders in their respective industries. This index, therefore, only includes a small number of India's largest and most well-known corporations. Investing in Index Mutual Funds that track the NIFTY 50 index is one method of getting the equivalent returns. NIFTY 50 was introduced in April 1996 with a base of 1000 points.
In 2021, the NIFTY 50 will mark its 25th year of existence. Its value has grown by nearly 18 times, and it is currently trading at approximately 17800. The NIFTY finished 2013 at 6,304 and has almost tripled in the previous eight years, achieving a 15% compound annual growth rate.
SENSEX
In India, the name Sensex refers to the BSE's benchmark index. With 30 of the BSE's largest and most actively traded equities making up the Sensex, it serves as a barometer for measuring the health of the Indian economy.
The Sensex moved from 21000 points in 2013 to crossing 60000 points in the last eight years. The index may reach 100,000 in five years if earnings growth picks up and structural reforms are implemented.
In the long run, continued financial inclusion, poor returns from conventional asset classes like fixed deposits, an increasing percentage of household investments in stocks, and more knowledge among millennial are expected to benefit equity markets. From a long-term viewpoint, stocks are likely to continue to be the best investment option.
Gold
In India, gold is considered to be one of the best investments. In addition to charm and prestige, it has major attractive features such as high liquidity and inflation-beating potential. The traditional method of investing in gold was to purchase actual physical gold in the form of coins, bullions, artifacts, or jewelry. Gold ETFs (exchange-traded funds) and gold mutual funds, both popular investment options, are accessible today.
In India, gold investors have had reasonably good returns over the past eight years. Prices have been driven upward by a combination of rising worldwide prices and a weakening rupee, providing investors with fairly decent annualized returns.
Get Free ebooks, guides & templates delivered to your email
We promise never to spam.


Some interesting comparisons:
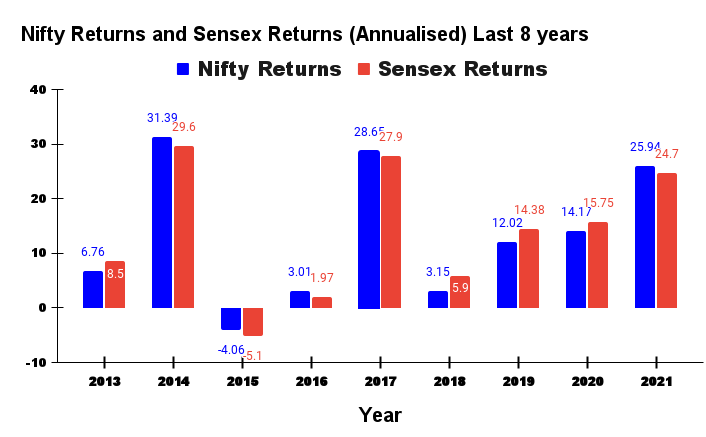
NIFTY vs. Sensex
While the daily movement of the two indexes differs somewhat, the variations are insignificant. Because most of the Nifty and the Sensex equities tend to overlap, both tend to follow a similar trajectory over time. No matter which one you choose, If you have a 10-year investing horizon, it makes no difference. The short-term performance of one index may be superior to the other, but the long-term trend is equal.
| NIFTY | SENSEX | |
|---|---|---|
| 1996 | Year created | 1986 |
| Benchmark of NSE | stock exchange | Benchmark of BSE |
| 50 | No. of companies represented | 30 |
| National Fifty | Full form | Sensitive Index |
| 1000 | Base value | 100 |
| NIFTY is broader as it has more stocks in it. | Small variation in index value | SENSEX is more niche, so might be valued slightly higher during bullish trends. |
| 24 different sectors are represented | Number of sectors represented | 13 different sectors are represented |
| Year | Nifty Returns | Sensex Returns |
|---|---|---|
| 2013 | 6.76 | 8.5 |
| 2014 | 31.39 | 29.6 |
| 2015 | -4.06 | -5.1 |
| 2016 | 3.01 | 1.97 |
| 2017 | 28.65 | 27.9 |
| 2018 | 3.15 | 5.9 |
| 2019 | 12.02 | 14.38 |
| 2020 | 14.17 | 15.75 |
| 2021 | 25.94 | 24.7 |
(Source: NSE &BSE )
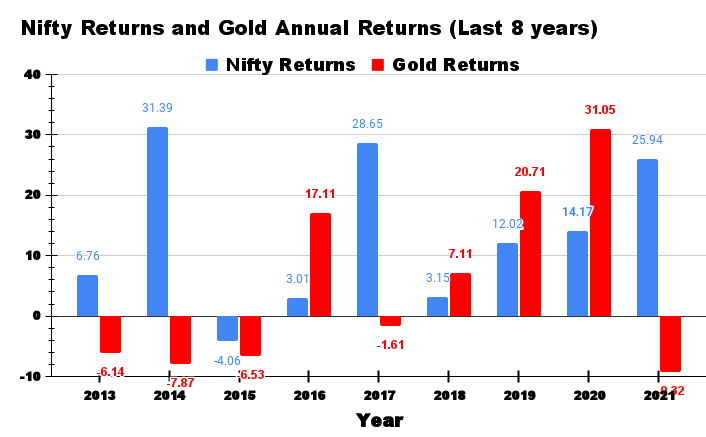
Gold vs. Equity (NIFTY and Sensex)
Gold is often regarded to be a more secure investment than equities. Gold has a substantial intrinsic value, making it a dependable safe-haven asset. Diversifying your investing portfolio between equities and gold is a prudent strategy.
Historically, the link between gold and stocks has been inversely proportional. When the stock market is most gloomy, gold performs quite well. This link between gold and the stock market holds true for all international economies.
However, because equity entails a greater degree of risk, the likelihood of more significant returns in equities is also greater. Additionally, equities provide dividend income and the ability to diversify your portfolio. You can invest up to Rs 1.5 lakh in ELSS (Equity Linked Savings Scheme) plans under Section 80C and get tax deductions after that.
| Gold | Equity | |
|---|---|---|
| Gold is a physical asset, which you can hold in hand. | Form of wealth | Equity is held in electronic form in a Demat account. |
| No diversification possible | Portfolio diversification | Diversification according to risk-taking capability |
| You have to sell the gold if you want to cash | Profits earned during the investing period | You may get regular dividends from stocks and payouts from mutual funds |
| Gold's price rises when the market is volatile because of increased demand for a safe-haven asset. | Volatility and price movements. | Equity price depends on the company’s financial performance and economy among other things. |
| Year | Nifty Returns | Sensex Returns |
|---|---|---|
| 2013 | 6.76 | -6.14 |
| 2014 | 31.39 | -7.87 |
| 2015 | -4.06 | -6.53 |
| 2016 | 3.01 | 17.11 |
| 2017 | 28.65 | -1.61 |
| 2018 | 3.15 | 7.11 |
| 2019 | 12.02 | 20.71 |
| 2020 | 14.17 | 31.05 |
| 2021 | 25.94 | -9.32 |
(Source: NSE & MCX )
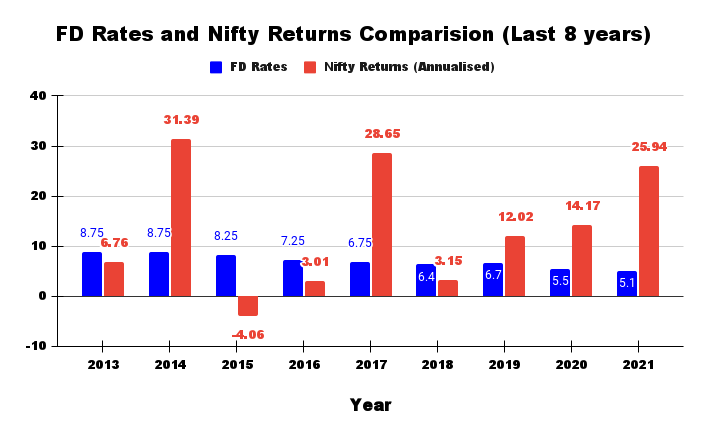
FD vs. Equity
Investing in the stock market might yield higher returns than investing in bank FDs. While Fixed Deposits (FDs) are praised for being a low-risk investment, if one invests well in the stock market, one may make a substantial return and have access to the money at any point in the future. Stocks don't have a "lock-in" period. It gives the advantage of diversity while also increasing profits in line with inflation.
| Fixed Deposit | Equity | |
|---|---|---|
| Capital protection (insured up to Rs. 5 lakh). | Investment goal | Wealth Creation |
| Limited options on tenure and interest rates. | Flexible Investment Options | Unlimited options based on your goals, time period and tenure. |
| No charges for opening/maintaining an FD account. | Investment Charges | Multiple charges such as maintenance charge, admin charges etc. |
| Interest earned is fully taxable as per tax bracket, but is exempt if deposited for minimum 5 years. | Income tax treatment | Long-term and short term capital gains taxes are levied based on the period of holding. |
| Year | FD Returns | Nifty Returns |
|---|---|---|
| 2013 | 8.75 | 6.76 |
| 2014 | 8.75 | 31.39 |
| 2015 | 8.25 | -4.06 |
| 2016 | 7.25 | 3.01 |
| 2017 | 6.75 | 28.65 |
| 2018 | 6.4 | 3.15 |
| 2019 | 6.7 | 12.02 |
| 2020 | 5.5 | 14.17 |
| 2021 | 5.1 | 25.94 |
(Source: NSE & MCX )
Present value in 2021 if Rs. 1 lakh invested in 2013:
By investing Rs.1 lakh in each of the securities in 2013, you'd have the following amount in 2021 if you had stayed invested:
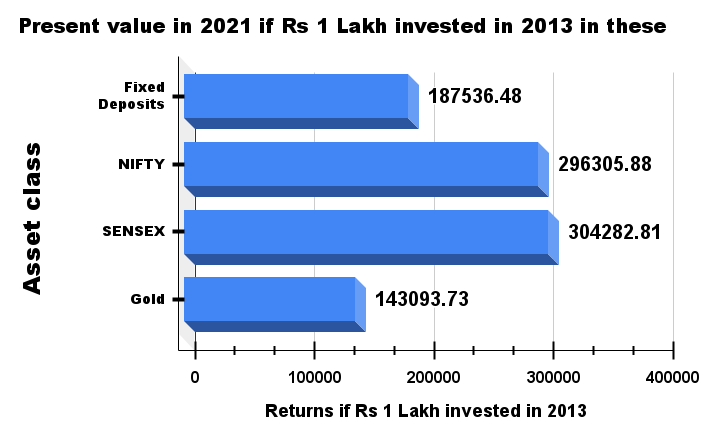
NIFTY AND SENSEX have both delivered similar returns. Between 2013 and 2015, gold suffered negative returns. And fixed deposit rates continued to decline year after year.
The following table summarizes the risk, reward, and liquidity characteristics of the four investing alternatives. It is by no means comprehensive.
| Investment type | Returns | Liquidity | Safety/ Risk |
|---|---|---|---|
| FD | Guaranteed and predictable | The penalty is to be paid if FD is liquidated before maturity. | Little to no risk |
| NIFTY | Possibility of high returns | High Liquidity as Nifty stocks are traded heavily. | High Risk in relation to market conditions, risk taking capability, etc |
| SENSEX | Possibility of high returns | High Liquidity as Sensex stocks are traded heavily. | High Risk in relation to market conditions, risk-taking capability, etc |
| GOLD | Low to average returns | It can be sold at any time to generate cash. | Relatively safe and less risky as gold is considered a precious commodity. |

Conclusion:
Due to the high level of safety offered by fixed deposits, their returns are the lowest of the four securities listed above and will remain so in the future. Sensex and NIFTY have consistently outperformed inflation over the long run. For a long time, gold has been a favorite with Indians, and that is likely to continue. In order to make the best choice for your investment portfolio, you must first determine your personal risk profile in relation to the risks connected with the product.